
I have been approached recently about explaining some of the fundamentals of how Wireshark can be used.
Let’s have a look at some traffic that I captured for a challenge I created recently.
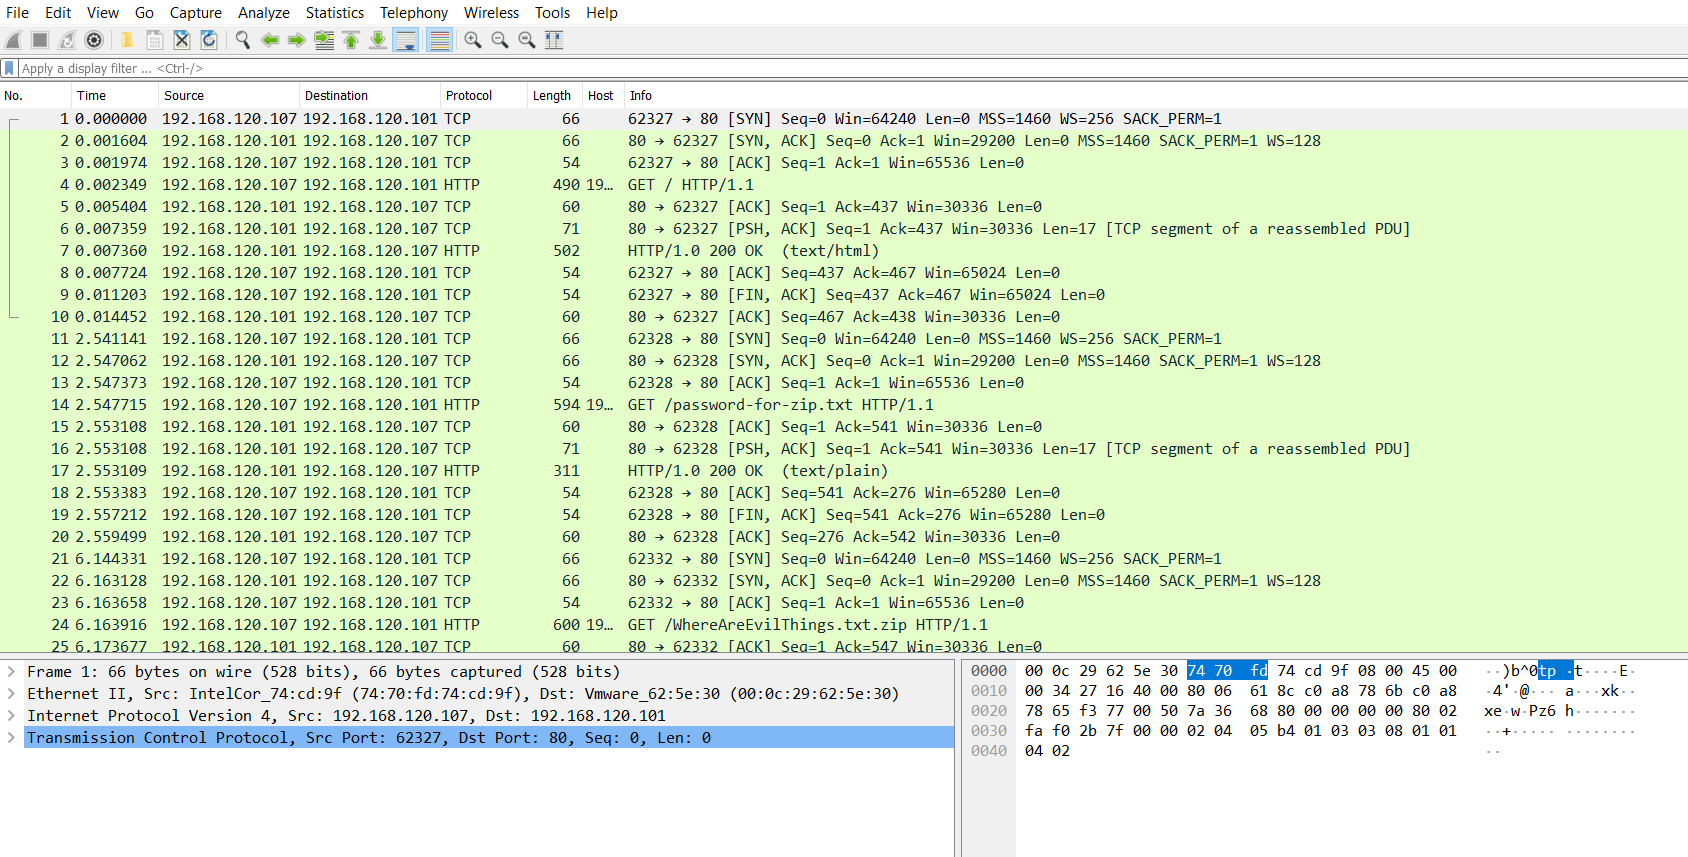
Here we can see an example of HTTP traffic that has already been captured. There are some things we can immediately pick up on from this view alone. We can see that we are not looking at HTTPS traffic, either this is a non-encrypted site or it has been decrypted by some other method.
The IP addresses in use are RFC1918 (not routable on the internet), meaning this was either internal to internal traffic, maybe a company intranet server on a small network. Or maybe we are looking at traffic from behind a NAT device. All of this information becomes important when you are doing this in anger, but for now it is simply for consideration.
Finally, we can also see 3 ‘GET requests’ in this traffic. This shows that the client requested something from the server (quick note, server simply means the machine dealing with the request, don’t get confused with Microsoft terminology). We can also see a couple of the responses with ‘200 OK’ meaning something that was requested was also served back to the client.
The problem we have here is that there are multiple streams of information, there are multiple requests all with their own responses. What if we want to single one of these out?
Follow Stream
In older versions of Wireshark you could only follow the TCP stream, this meant if the traffic was encoded in anyway you would not be able to see what the user would see in their browser after it was decoded.
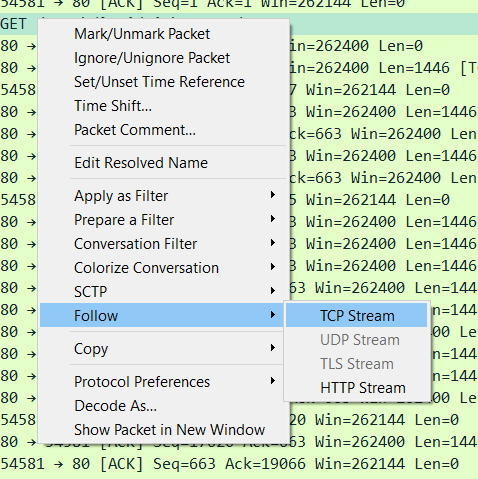
Above you can see the ‘right click context menu’ that lets you see how to follow a stream. If you were to follow a stream on a encoded stream, this is what you would see:
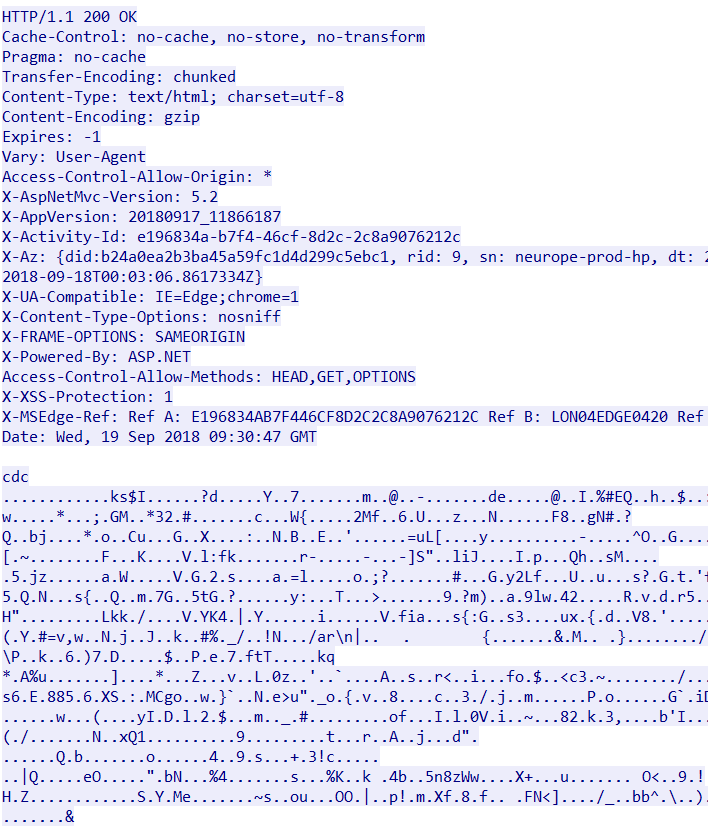
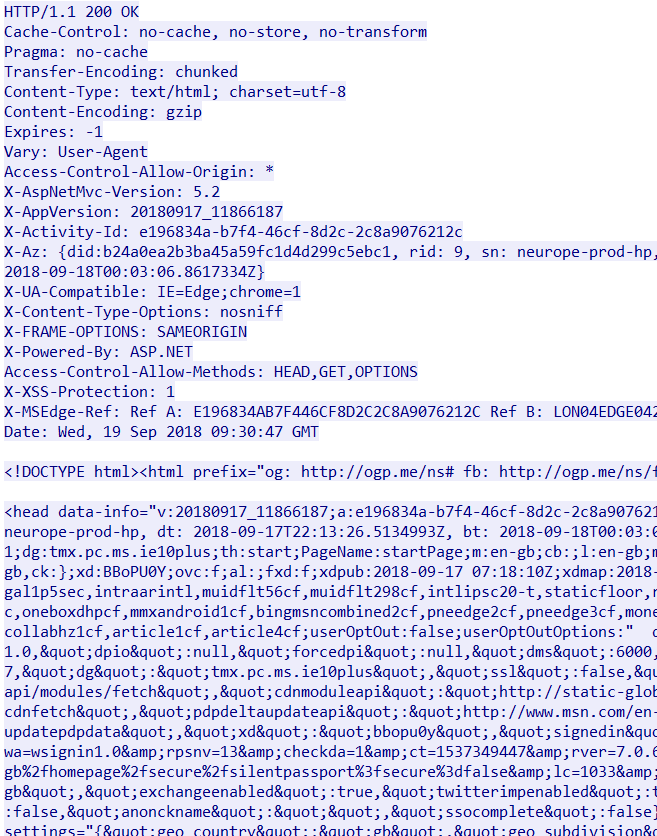
The top part is the header which ends with the ‘Date:’ field. All after the new line is encoded text that you aren’t able to decode from here (one it’s just plain hard, two there are non-ASCII characters which are represented by dots)
If we follow the HTTP stream however
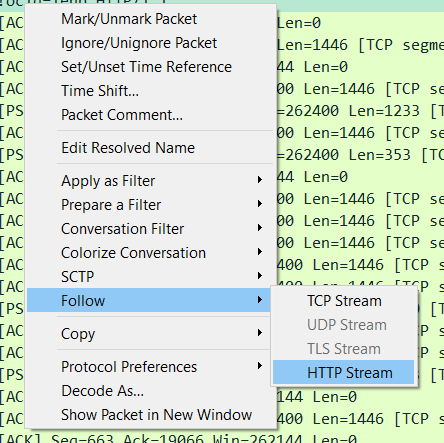
We will see the decoded stream:
While this particular case may not be easy to read, it is typical of what you might encounter. As a network analyst you may need to work with the malware reversing team to fully understand some of the data you are looking at. Javascript is often obfuscated, which means the developer either doesn’t want someone looking at their code or they are trying to reduce the size of the data being transferred.
Why do I care?
If you are lucky enough to be working with full packet capture you need to be able to know how to use one of the most commonly used analyst tools. Wireshark has is limitations, but for looking at a small sub-set of traffic and wanting to know exactly what happened, it is excellent.
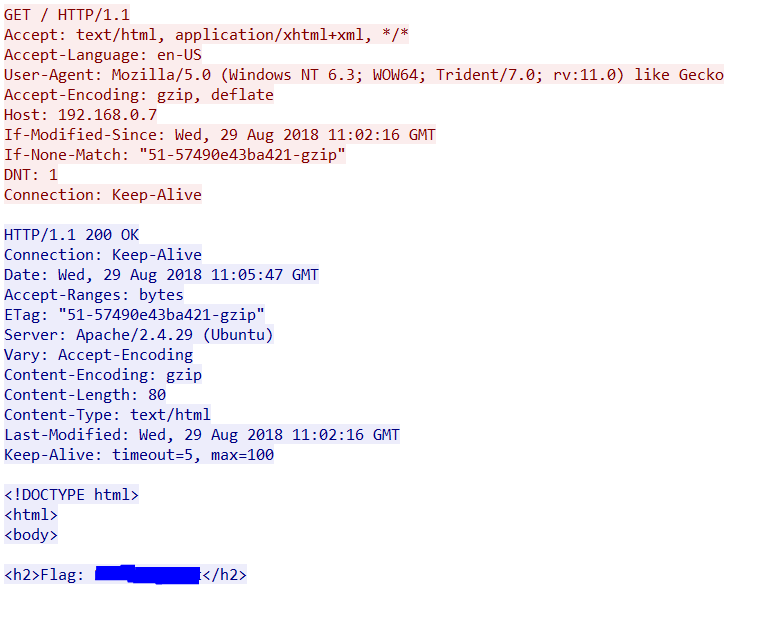
As an example, we can see in this traffic stream above the contents of the web page without having to visit it. We can see that the page that was served did not have any malicious scripts or file downloads on it. It simply had a header with a flag in it (this is a real flag, so I hid it 🙂 )
Conclusion
We have covered the basics around following a HTTP stream and a TCP stream and why each is different in the context of HTTP traffic.
This may seem like simple to a lot of people, but to new people entering the industry, this could be the thing stopping you from winning that competition, or failing a technical test. Network analysis is important, there is a lot of cool information you can see on the wire!
