HTTP Methods

In this post we are going to look at different types of HTTP/1.1 methods. We will leave HTTP/2 methods for another day.

This will be a summary of each method, it is possible to go into great detail with some of these points, but that would get tiresome to read (and write).

What is an HTTP ‘Method’?

With HTTP communication there is often a lot of information being sent backwards and forwards. Some of this is completing previous requests, some is new and occasionally some is erroneous. The client and server both need to quickly be able to see what is happening and how to deal with this communication.

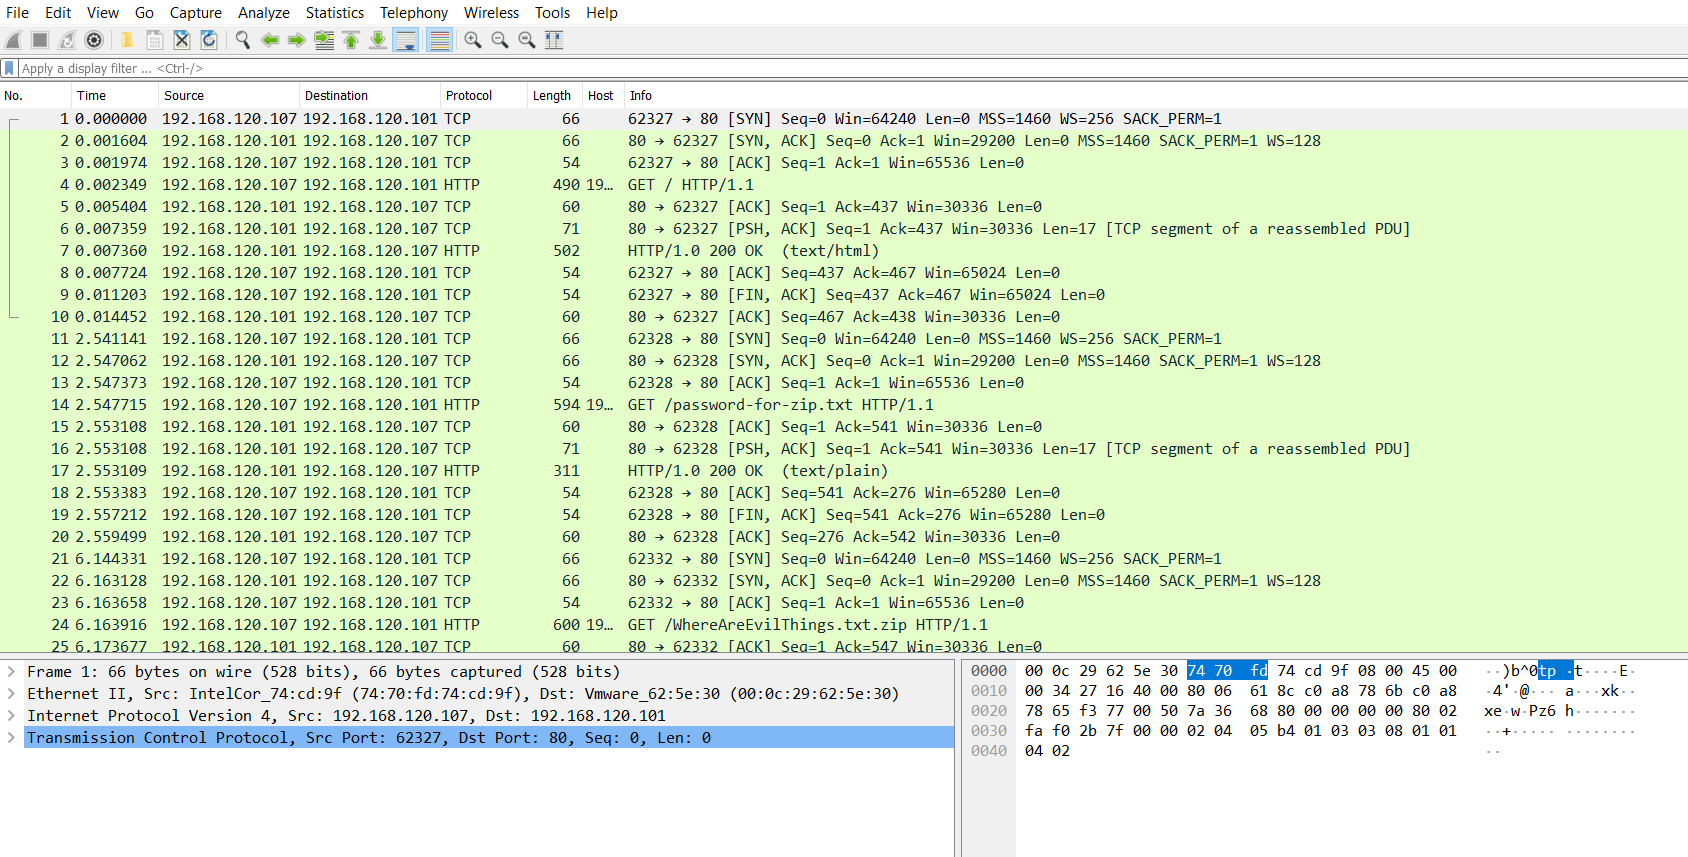
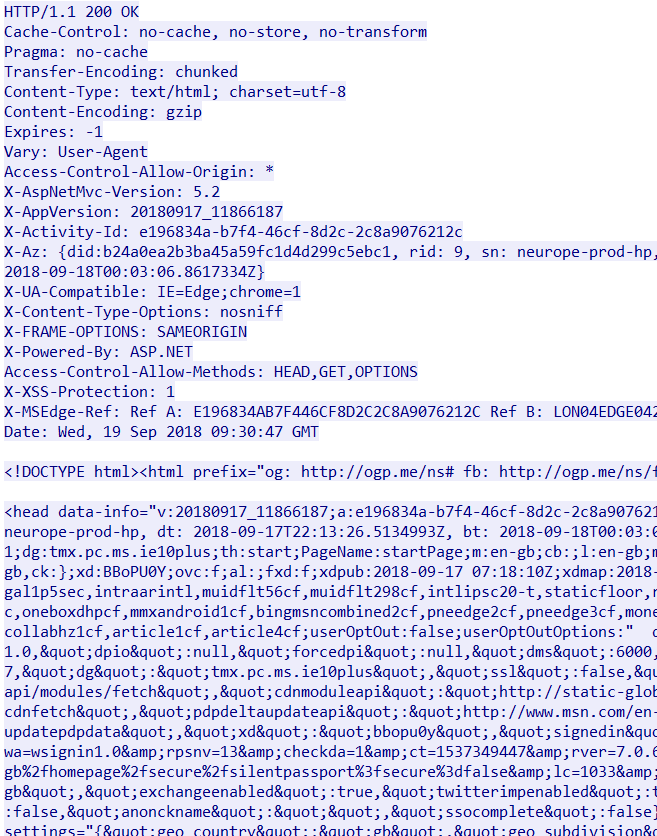
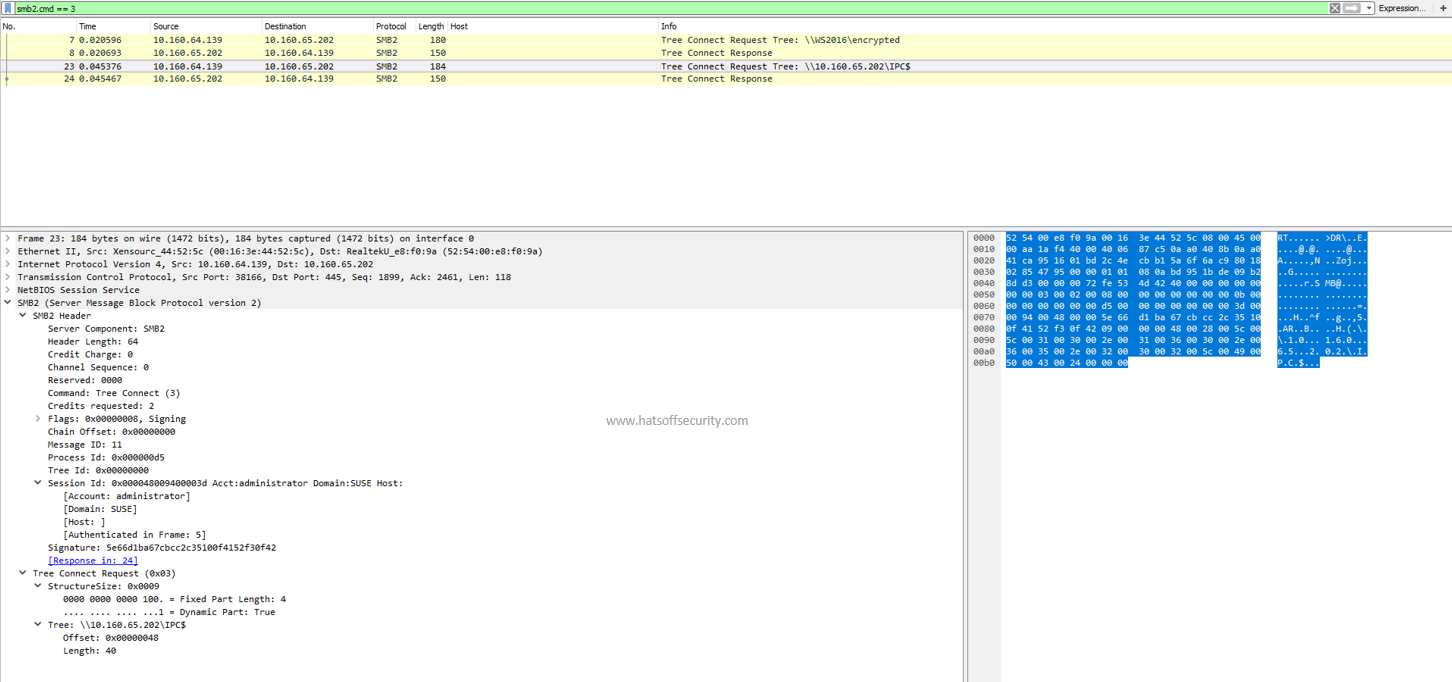
The HTTP method is at the very start of the HTTP communication

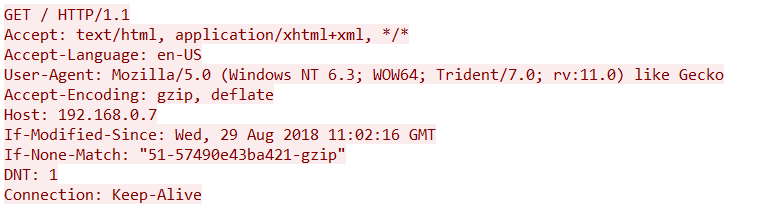
As we can see on the above screenshot the very first word on the top line is GET. GET is an HTTP method. This is the same for any new communication as it allows the server to process the request in an appropriate way as efficiently as possible.

GET

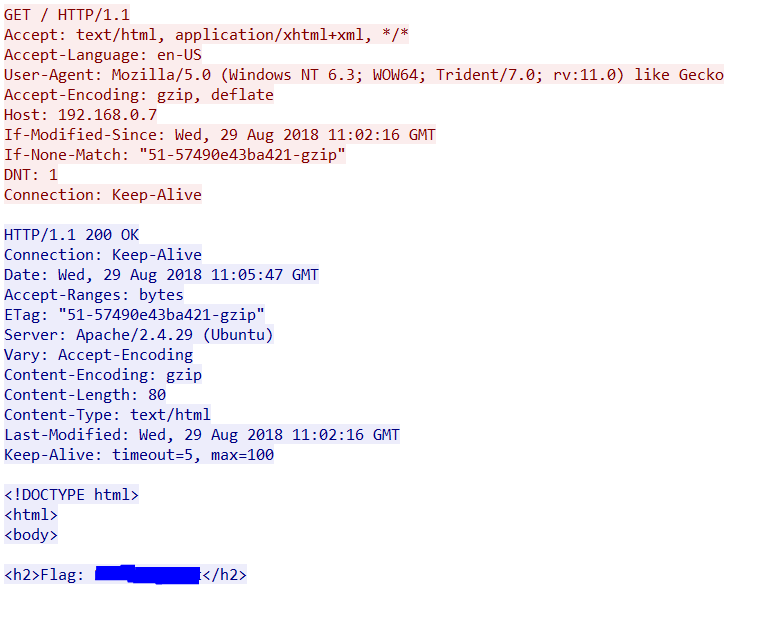
This is the most common request from a user’s perspective. When you loaded this page your browser issues a GET request to the host “hatsoffsecurity.com” with a request for the specific resource. If you are viewing this from the main page the request would look similar to above requesting a forward slash. If you were clicking a link you would be requesting ‘/2019/04/09/http-methods’ as the resource.

Separate GET requests are generated for additional resources on that page, even down to the favicon which shows up in the tab on most common browsers.

Results of a GET request can be held in the browser cache and will appear in the browser history. The GET request itself should not be transmitting any data, only the header.

Side note – this used to display next to the URL, but browser creators removed it to stop people using padlocks to trick people into thinking the site was secure when it was’t

POST

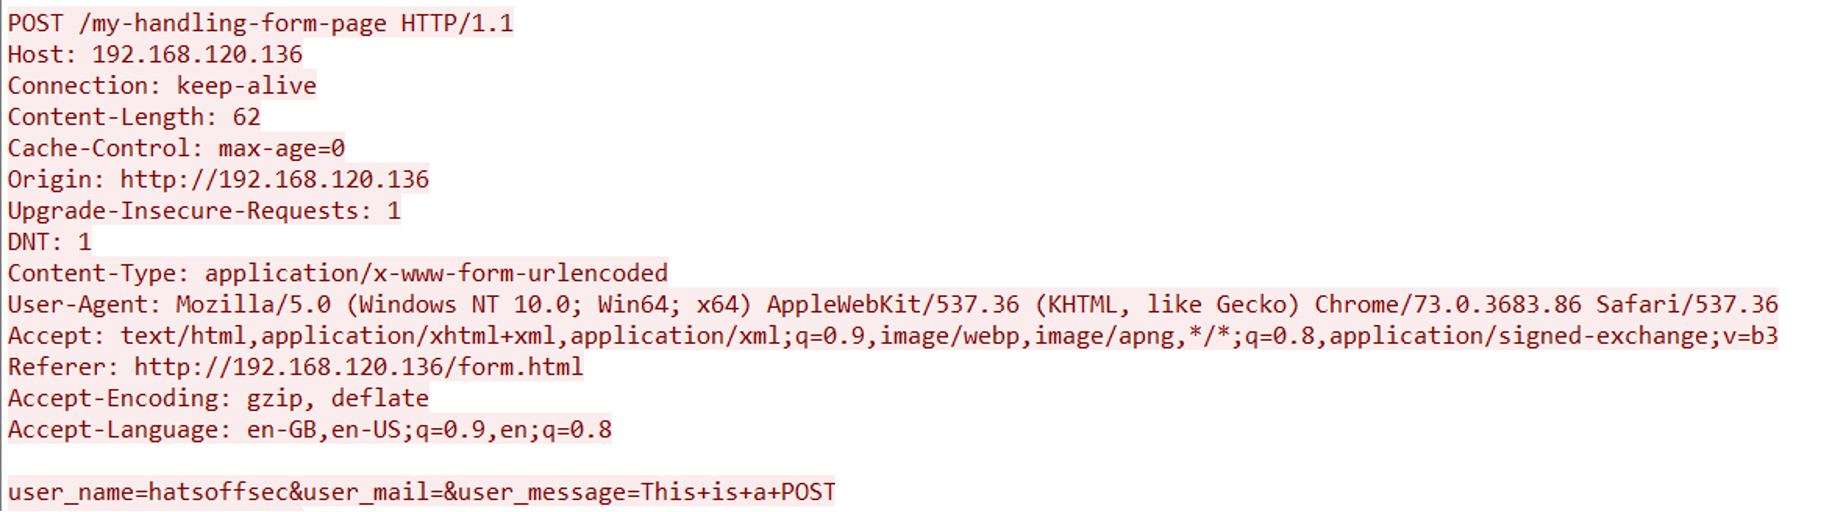
A POST request is used if you are sending data to the server. An example of this could be that you complete a simple form. This data is then sent form the client to the server where it is dealt with depending on the configuration of the server.

This process is slightly more secure than a GET as the data can be sent inside the request. With a GET this data would be sent in the URL which would mean it was recorded in the server logs and in the browser history.

POSTS can also be used to exfiltrate data by an attacker. While this is a very noisy method, it could be used in a ‘smash and grab’ attack; where the attacker has no interest in being stealthy, but instead just wants to be fast.

HEAD

A HEAD request works the same basic way as a GET request, the difference is with the response. The major difference being that the HEAD request only requires the return header and no data.

This is seen quite often with bots. Consider a search engine may index your entire page on an hourly basis, this requires a lot of time and energy on the part of the bot. If they instead send a head request and check for details like Content-Length, Content-MD5, ETag or Last-Modified, then there would be far less work required for sites that haven’t been updated.

PUT

PUT is a way of interacting with the server without causing successive changes. For example if you wanted to create a family tree on a website you could PUT the date of birth on server as this would not change. Even after a family member passes away their birth-date remains the same.

This idea of not changing the data on the server is referred to as ‘idempotent’ and Mozilla have a good Glossary on it here

DELETE

More commonly expected to be seen with an API than with normal user activity, this HTTP method simply deletes the resource that has been identified in the API. Like PUT this is idempotent and after the first time the delete request is actioned by the server subsequent requests will simply return a 404 not found response.

Connect

The CONNECT is most likely to be seen connecting to proxy servers in order to authenticate before the users encrypted browsing session begins. This allows non-SSL breakout proxy servers to monitor web activity. This can also be used for non-encrypted traffic in the same way.

OPTIONS

The OPTIONS header is a way of asking which HTTP methods are allowed by that site. This is now mostly seen in pre-flight CORS checks, which I won’t be covering here.

It is important to realise that OPTIONS should not contain any data and the response should be quite short, simply stating which HTTP methods are accepted. This would be a good candidate for command and control traffic.

TRACE

This is the HTTP version of Ping or Traceroute in the sense that it creates an ‘application layer loopback’ to the recipient sever. It has a ‘Max-forwards’ field that can be decremented at each forward. The recipient simply responds with the same method with 200 as the response code.

This would be unusual to see in a normal user environment, this type of activity should really only be seen in a dev or web-dev environment, or for testing proxy chains for infinite loops.

PATCH

Another API heavy HTTP method, this could be used after a PUT has created a resource on the server. You don’t want to replace the resource, but you do need to update it. As such you can send the amendments using the PATCH method. This is very unlikely to be seen in a user browsing context.

Why do I care?

This is a case of ‘knowing normal’, if you know why a POST might appear unusual vs a GET, you suddenly see a spike in OPTIONS or a domain controller suddenly starts sending out lots of encrypted traffic surrounded by CONNECTS, then you can begin to investigate with the knowledge that it is unexpected behaviour.

It is important to realise that in the immortal words of Phil Hagen; there is no RFC police. These methods are generally agreed upon principles, and there is nothing stopping a developer from using these methods in an unexpected way. Whether that be via an API or a new browser.

Understanding the different methods also allows us to build our knowledge of HTTP and how the internet works from a browsing perspective.

Posted in Network Analytics | Tagged , , , | Leave a comment

Wireshark – More Basics

I have been approached recently about explaining some of the fundamentals of how Wireshark can be used.

Let’s have a look at some traffic that I captured for a challenge I created recently.

Here we can see an example of HTTP traffic that has already been captured. There are some things we can immediately pick up on from this view alone. We can see that we are not looking at HTTPS traffic, either this is a non-encrypted site or it has been decrypted by some other method.

The IP addresses in use are RFC1918 (not routable on the internet), meaning this was either internal to internal traffic, maybe a company intranet server on a small network. Or maybe we are looking at traffic from behind a NAT device. All of this information becomes important when you are doing this in anger, but for now it is simply for consideration.

Finally, we can also see 3 ‘GET requests’ in this traffic. This shows that the client requested something from the server (quick note, server simply means the machine dealing with the request, don’t get confused with Microsoft terminology). We can also see a couple of the responses with ‘200 OK’ meaning something that was requested was also served back to the client.

The problem we have here is that there are multiple streams of information, there are multiple requests all with their own responses. What if we want to single one of these out?

Follow Stream


In older versions of Wireshark you could only follow the TCP stream, this meant if the traffic was encoded in anyway you would not be able to see what the user would see in their browser after it was decoded.

Above you can see the ‘right click context menu’ that lets you see how to follow a stream. If you were to follow a stream on a encoded stream, this is what you would see:

The top part is the header which ends with the ‘Date:’ field. All after the new line is encoded text that you aren’t able to decode from here (one it’s just plain hard, two there are non-ASCII characters which are represented by dots)

If we follow the HTTP stream however

We will see the decoded stream:

While this particular case may not be easy to read, it is typical of what you might encounter. As a network analyst you may need to work with the malware reversing team to fully understand some of the data you are looking at. Javascript is often obfuscated, which means the developer either doesn’t want someone looking at their code or they are trying to reduce the size of the data being transferred.

Why do I care?

If you are lucky enough to be working with full packet capture you need to be able to know how to use one of the most commonly used analyst tools. Wireshark has is limitations, but for looking at a small sub-set of traffic and wanting to know exactly what happened, it is excellent.

As an example, we can see in this traffic stream above the contents of the web page without having to visit it. We can see that the page that was served did not have any malicious scripts or file downloads on it. It simply had a header with a flag in it (this is a real flag, so I hid it 🙂 )

Conclusion

We have covered the basics around following a HTTP stream and a TCP stream and why each is different in the context of HTTP traffic.

This may seem like simple to a lot of people, but to new people entering the industry, this could be the thing stopping you from winning that competition, or failing a technical test. Network analysis is important, there is a lot of cool information you can see on the wire!

Posted in Network Analytics, Network Forensics, Wireshark | Tagged , , , | Leave a comment

Decrypting Traffic in Wireshark

If you have a HTTPS session captured and are looking at unlocking the secrets that lie within, you are probably looking at Wireshark with eternal optimism hoping that somehow the magical blue fin will answer all of problems….

Sadly that’s not quite the case…. but it will help.

(To help me structure this post I am going to use a CTF challenge as a walkthrough. It was originally a DEFCON CTF, then was later picked up by root-me.org, if you want to play along at home click here)

Encrypted Traffic in a PCAP? I’m outta here!!

Hold your horses, there is a lot of useful information in an encrypted PCAP that may help you to find a weakness, or even all the information you need. In this instance we can see that the network traffic is using a certificate that has had the private key published online.

People don’t publish private keys online!

……. ummm …… yes they do. A friend of mine, Kev ‘TheHermit’ Breen created a Pastebin scraper (PasteHunter) that uses Yara rules to check pastes for interesting stuff then indexes them. He did a presentation at CyberThreat 2018 giving a summary of (redacted) results, amongst them, private keys. It is also possible to find some using Google searches, however most people have become wise to this method (normally the hard way).

So you’re saying this is easy?

Well… no. 99.999…% of the time you will need to get the private key in a legitimate way. You can’t simply google for Microsoft’s private key. The exception is typically in a contrived situation, like a CTF. Which is what we are discussing!

However the point of this post is to show how to do this when someone gives you the private key file.

Back to the CTF

This CTF gives you a clue to use google and tries to lead you to an old Github page that has this key listed as ‘expired’  (https://github.com/Hypernode/M2Crypto/blob/master/demo/x509/server-expired.pem)

The fun thing about CTF’s is that there is no single way to solve them. So with some creative thinking and lots of searching I found that the certificate has been around the houses a few times:

Anyway, we are getting off topic! I suspect this is an old challenge and hasn’t been updated when the certificate was replaced on the original Github page.

The bit we are interested in is the Private Key, everything else will just break Wireshark. So we grab the following:

-----BEGIN RSA PRIVATE KEY-----
MIIBPAIBAAJBAKy+e3dulvXzV7zoTZWc5TzgApr8DmeQHTYC8ydfzH7EECe4R1Xh
5kwIzOuuFfn178FBiS84gngaNcrFi0Z5fAkCAwEAAQJBAIqm/bz4NA1H++Vx5Ewx
OcKp3w19QSaZAwlGRtsUxrP7436QjnREM3Bm8ygU11BjkPVmtrKm6AayQfCHqJoT
ZIECIQDW0BoMoL0HOYM/mrTLhaykYAVqgIeJsPjvkEhTFXWBuQIhAM3deFAvWNu4
nklUQ37XsCT2c9tmNt1LAT+slG2JOTTRAiAuXDtC/m3NYVwyHfFm+zKHRzHkClk2
HjubeEgjpj32AQIhAJqMGTaZVOwevTXvvHwNEH+vRWsAYU/gbx+OQB+7VOcBAiEA
oolb6NMg/R3enNPvS1O4UU1H8wpaF77L4yiSWlE0p4w=
-----END RSA PRIVATE KEY-----

You need to include the hyphens at the beginning and end to.

Now we have this bit, save it as a .pem file (server.pem maybe?), the name isn’t important, only the file extension.

Using the .pem file in Wireshark

Right, we have stuff we need. Stuff is important.

There are a couple of ways of doing this, I am going to use the menus on the main Wireshark window. This is done in version Wireshark 2.6.4. I doubt they will move the bits I am talking about… but they may go full-Microsoft on us at some point.

Go to Edit > Preferences

In the preferences screen that pops up, you want to go to the left side and look for “Protocols”, expand this out and find “SSL” (I typically press ‘T’ then it’s at the top of the screen).

On this screen you want to click on the RSA Keys List button. You should also specify a debug file, this will create a text file that will help you should something not work. Have a look at a working version (after following this guide) so you know what it should look like.

Add the server IP address, the port (in this case it’s 4433 instead of the default 443), protocol TCP and the location of the key file. Leave the password blank.

OK your way back to the main screen.

Normally you would now ‘Follow SSL stream’, however that doesn’t work here, possibly because Wireshark doesn’t know what to do with the data (it’s not web browsing, hence no ‘site details’ as per my previous post).

If we now look through the packets we can see that packet 13 sticks out, it has a lot of flags set and is a malformed packet. When we investigate further we see this…

If you look to the right, you can see why Wireshark declared this malformed, all of the fields have been manipulated to print out a message.

Why do I care?

The CTF was used as a mechanism to demonstrate how to decrypt data in Wireshark. So you don’t need to care about the challenge, but knowing how to add a private key is very important. This is the type of task IT staff would assume the security people can do, but if you have never tried it, this allows you to play.

Looking at encrypted traffic could provide the case your working on with that critical piece of evidence the bad guy thought they had hidden.

This also shows that network forensics is not going anywhere, HTTPS is a GOOD thing and should be embraced. We can put technical steps in place to allow us to keep using HTTPS and HSTS while still maintaining the level of detection we have always had.

Posted in Cryptography, Encrypted Traffic, Network Analytics, Network Forensics | Tagged , , , , , , , | Leave a comment

Identifying Sites in Encrypted Traffic

There is some mis-information around; that encrypted traffic is useless, and you should go back to netflow and statistical analysis only. I disagree. I will be doing a few posts showing clear-text information leakage we can use to our advantage.

Let’s start with a biggy;

What site was visited?

Imagine you need to prove a user went to a specific website. Providing the site isn’t on the HSTS pre-load list within the browser, you can see this. (We will visit HSTS and the pre-load another time, but for this instance we will assume malware, or nefarious activity which wouldn’t be included in this list).

I am going to pick on the truly evil wikihow website (just because I used them in a HTTP-PCAP-CTF a few years back before they moved to HTTPS and now I am proud of them 🙂 )

So a user is suspected of faking their new job and visiting wikihow to see how to do stuff. We check the packet capture and run a filter looking for GET requests to wikihow.com. We don’t see any…. then the IT dept tells you SSL breakout broke a while back, and the CEO dictated it was turned off as it was stopping him streaming…. work…. stuff.

Now we have an issue. We filter this users machine, pull the packets only for the time frame this person was suspected of the activity (cutting many corners for ease here, just go with it). We find lots of SSL Handshakes and have a closer look…..

Easy right?

Kidding 🙂 The answer is actually under “Extension: server_name”, but there is an easier way. Follow stream!

The orange coloured part is outbound from my PC, the blue part is the response. You can see here “www.wikihow.com” in the packets.

We can also see something interesting in the response. This is a shared certificate and all of the sites listed share this certificate. I am not going to cover certificates, as this would need me to talk about key exchanges which hurts my head. Just accept that certificates can be shared and data is still secure… ok? cool. If you want to know more, there are lots of really interesting sites on the subject.

Why do I care?

This information can help with an investigation while you are waiting for someone to bring you the private key, or if no keys are available. You can at least check all of the requested sites. This would be the encrypted equivalent of looking at all GET requests (kind of… all GETs would also show resources within sites, this won’t… but you get what I mean).

If you want to look for all ‘Client Hello’ requests in a PCAP use the following Display Filter

ssl.handshake.type == 1

Red Team Recon

This is a nice easy way for pentesters to recon a site with normal user behaviour. Looking at the response to the Origin API (see last paragraph) I can now see lots of sub-domains to play with:

What information does your certificate leak about your company?

Side note

This can be interesting to see what your machine is doing, while I was running this capture I also unintentionally captured a request going to api1.origin.com. I have the origin client installed, but it wasn’t running at the time. Now I know that Origin has a service that runs in the background doing something…..

Posted in Encrypted Traffic, Network Analytics, Network Forensics | Tagged , , , , , , , | Leave a comment

SMB2 Protocol Negotiation

This is one of the few times when looking at SMBv2 you will need to use SMBv1 commands. The initial negotiation request will always be sent out as SMBv1. It makes sense when you think about it, SMB does not have ‘backwards compatibility’, instead it relies on negotiating to the lowest common denominator.

To find the initial request use the following SMBv1 command

smb.cmd == 0x72

If the server responds using the SMB2 protocol a second negotiation is sent. This time on SMB2.

To see all SMB2 negotiation and responses you will need the following command

smb2.cmd == 0

During the negotiation you are able to see what capabilities the server has, what the client has and any negotiated authentication/encryption technique. You can also see the time that is set on the server, as well as its Timezone.

Why do I care?

There is a lot of useful information in here to help with Server identification and potentially geographical location. Looking at the capabilities of the server can with OS identification; is it a Windows box, a NAS etc.

Using the SMBv1 filter you are able to see the first communication between the two devices, aiding in timeline building.

Posted in Network Analytics, SMB | Tagged , , , | Leave a comment

SMB2 – File/Directory Metadata

Using SMB it is possible to retrieve data that is typically only expected when carrying out host based forensics.  The MACB (Modification, Access, Change and Birth) data is sent across regardless of if a file is accessed or not.

With SMB v1 this was a bit of a pain to find, the Wireshark filter required was

smb.cmd == 0x32 && smb.trans2.cmd == 0x0005 && smb.qpi_loi == 1004

with SMBv2 it is simper

smb2.create.action

This command can have a value added after it, however in its current state it is the equivalent of having “exists” on the end.

The output looks different to SMBv1 as you would expect, but the data is the same.

SMBv1

SMBv2

With SMBv2, the simple addition of a column provides us with the path detail that was removed from the SMBv1 command

Why do I care?

As you can see from the screenshots, this shows what files were accessed. If you look closely at the second screenshot you can see that a file named “~$resource-to-share.xlsx” was referenced. When you look at this you can see it talks about a file being created on the share. This tells us two things.

  1. We can see when files are uploaded to an SMB share
  2. The Excel file was opened on the local machine as that is the temporary file Office creates to allow auto recovery on crash

The above is from a Windows Server 2016 VM I have in my home lab, but I have also tested this on my NAS and got the same type of results.

Posted in Network Analytics, Network Forensics, SMB | Tagged , , | 1 Comment

SMB Tree Connect/Response Details

If you want to play along at home, the sample PCAP I will be using for SMB2+ is here, the SMB v1 PCAP is not something I can give away sadly.

Tree Connect Request/Response

When the SMB protocol connects to a resource it needs to know exactly what is there. This is where the OS retrieves the share name. If the share name has a ‘$’ at the end (like IPC$ or C$) this means the share is hidden, typically the system will create hidden shares, but users can also create them. Hidden means that if you were to go to the root of the resource (\\servername\ ) you would not see the hidden shares listed.

Tip. If you are monitoring SMB and see \\servername\exfil$…. might be worth looking at!


SMB v1 looks like this:

SMB v2 on the other hand looks like this:

So what’s the difference?

As you can see there are some cosmetic changes, the ‘andx’ part has been dropped. The biggest difference for me is the addition of the ‘SessionID’ details in v2, this now provides the requesting username* and the requesting client

In the Hex the Flags have been moved and v2 has less Flags. We can still see the path in the details pane.

*It is worth noting that the username is the one used to connect that share, not the one which is logged on locally. This can be entered when the share is initially created, or is prompted for when the user clicks on the link. Bear this in mind during investigations


Posted in Network Analytics, Network Forensics, SMB | Tagged , , , | Leave a comment

SMBv2+ SYNC Header Explained

SMB2 Header

The SMB2 Header will either be ASYNC or SYNC, you need to look this up from the flags. SYNC is the most common header as this can be in the form of a request or a response, where as a ASYNC header will be used for responses to requests processed asynchronously by the server.

Credits

The Credit Charge field appears to be either 0 or 1 and will only be 0 on protocol negotiation (initial communication) after that it will be set to 1.

Credits appear to be a way for the client to control the requests being sent in that session, providing the client has credits remaining, it can continue to communicate. You would expect to see the ‘Credits Granted’ = 1 if the server is answering a request.

NT Status

This will only be seen in responses and will give the status, or error, of the request. ‘STATUS_SUCCESS’ is as it sounds, and will typically be expected from a successful tree connection

Channel Sequence

Channel Sequence is explained by Microsoft as “In a request, this field is interpreted in different ways depending on the SMB2 dialect.”

…which is helpful…

Reserved

This is reserved… no seriously, don’t use it. SMB’s version of the ‘evil bit’?

Command

The command section will have one of the following commands within it:

Flags

The Flags field will be populated thus:

Chain Offset

Microsoft refer to this field as “NextCommand” and say it must be offset from the first header. However every instance I have seen has this set to 0x00000000

Message ID

This field is very useful as it identifies individual messages (conversations) within the SMB protocol. If you follow stream on an SMB conversation in Wireshark you will see a large number of messages, which can get confusing, this way you can see what the request and outcome was to each request.

Use the following filter in Wireshark

smb2.msg_id == ##

Where ## equals the message ID you want to track

Process ID

The default value is 0x0000feff

When it is not set to default (or 0x00000000) it can be used to manage broken connections. For example if the server sends a pending response the client can decide send a cancel request to the server to stop that particular message from consuming resource.

Tree ID

Another useful field, within the Tree Connect Response this field will contain an identifier to a share. This means if you are investigating a lot of SMB2 traffic across many shares, this will help you keep track of a specific one.

smb2.tid == <hex value>

Where <hex value> is the hexidecimal value displayed in this field

Session ID

The Session ID will help track a specific user session, similar in usefulness to Tree ID, it will allow you to see if a new username was used. It can also show failed logon attempts, as the value will change with each new authentication attempt.

Signature

This field will be set to 0 if the Signing Flag is set to not signed.

This appears to be used for verification and encryption. Most likely to be seen in environments that utilise SMB encryption

Summary!

We have covered SMB v2 SYNC header. This was mostly based on Tree Connect and Response, as this was the original post!

Why do I care?

If you need to look at SMB on any modern system there are some good artefacts in the SMBv2 header.

I hope this helps, feel free to comment.

Posted in Network Analytics, Network Forensics, SMB | Tagged , , , , | Leave a comment

SMB Quick Introduction

SMB

There are currently 3 major versions of SMB version 3 is quite new (2012) and has been implemented on the latest versions of Windows (8, 2012), Samba 4.1+ and macOS 10.10 Yosemite.

I say ‘quite new’ as it takes a while to phase in new protocols like this. At the time of writing I would expect most organisations to be running MS Server 2008 to Server 2016.

The above chart (from here) shows that as different OS’s communicate they drop to the lower version of SMB to enable transfer. From this we can extrapolate that MS Server 2016 will use v3+ with MS Server 2012 upwards.

SMB History

There is a lot out there about SMB History, but the basic takeaway is Micrsoft needed something that allowed the sharing of resources across a network. They were beaten to it by a couple of vendors, but as MS had pretty much cornered the market… well you can guess the rest 🙂

If you want an in-depth history, there are many sites on the ‘net that provide that, I would only be copy/pasting someone else’s work.

SMB v1 was released mid 90’s

SMB v2 was released with Vista (mid 2000’s) and provided a host of updates both security and operations

SMB v3  was released with Server 2012 and is sometimes referred to as SMB2.2. This is most relevant to us when looking at Wireshark filters. There is no filter ‘smb3’ only

smb || smb2

SMB !=CIFS

Well technically SMB2+ != CIFS.

CIFS was a term used for NT4 operating systems, it does not apply to later versions of SMB.

Why do I care?

SMB is the way a Windows environment would open files on a remote server. This means you can actually see the username that opened the file!

Imagine having full packet capture when you get a phone call explaining some sensitive information has just appeared on Pastebin. The management are losing their shit and you could potentially be the one to answer the big question; whodunnit?

Over the next post or so I will look at how to find that information.


Posted in Network Analytics, Network Forensics, SMB | Tagged , , , | Leave a comment

Unique Usernames!

I recently created a cloud based virtual machine, the purpose of this will be for an HTTP honeypot, but I thought first off I would leave it for a few days to see what happened. This VM has only port 22 open and the IP has not been published anywhere.

Within 30 minutes the brute force attacks had started!

I decided to keep an eye on what usernames were being used and realised that a lot of people are still setting up their systems with ‘root’ or ‘admin’

Even if your password, or key, are super secure and you are 100% confident they will never be guessed/cracked, there is still logic in creating weird and wonderful usernames. Mine for example is made up of items I saw on my desk, I then saved that username to LastPass for reference.

What logic you ask? Well let me create a scenario….

You create a server and have root as the only user (silly person). You give it a 32 character random password and sit happily in the knowledge it can’t be brute-forced. You then look at your auth log and see several thousand attempted root logins per day, as per below (screenshot after 48 hours). Two questions:

  1. Are you under attack?
    1. Yes.
  2. Are you under a targeted attack?
    1. No idea!

Now let’s keep the same scenario except the username has now been changed from ‘root’ to ‘HOS_Desk_Envelope’, this makes creating an alert so much easier. With only a single failed instance you can say that someone has a higher level of knowledge than they should about your build. Have you had an OpSec leak? Is your username on Pastebin? Or did a staff member simply type an incorrect password. Let’s go back to our questions:

  • Are you under attack?
    1. Yes.
  • Are you under a targeted attack?
    1. No.

Such a simple change provides such a huge benefit. No one, company or individual, should be using generic usernames in internet/production systems.

For reference, here are the top 50 usernames along with how many times they were tried in a 48 hour period on a server that isn’t advertised anywhere.

15719 root
254 admin
36 user
24 ubnt
21 support
20 service
18 test
16 ftp
16 default
14 guest
14 111111
13 super
13 adm
13 1234
11 operator
10 usuario
10 pi
10 manager
10 ftpuser
10 22
9 nagios
8 user1
7 123321
6 ubuntu
6 administrator
5 testuser
4 telecomadmin
4 plcmspip
4 osmc
4 master
4 client
3 sysadmin
3 git
3 elastic
3 0101
2 zabbix
2 uucp
2 tomcat
2 sysadm
2 supervisor
2 student
2 steam
2 sinusbot
2 scan
2 raspberry
2 postgres
2 PlcmSpIp
2 oracle
2 Operator
2 mysql

Posted in Attack, Brute force, Network Analytics, Network Forensics, Protocol, SSH | Tagged , , | Leave a comment